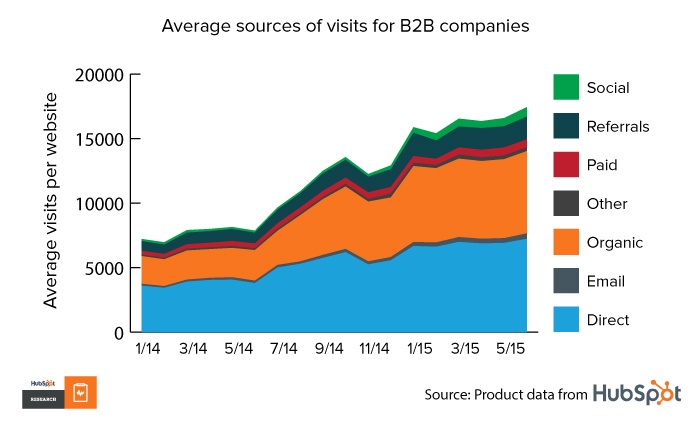
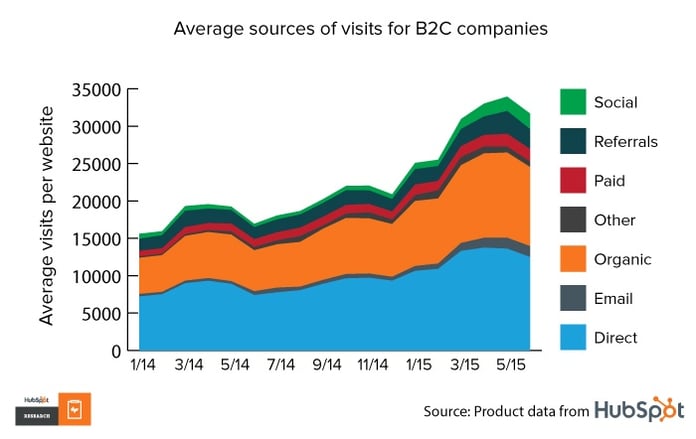
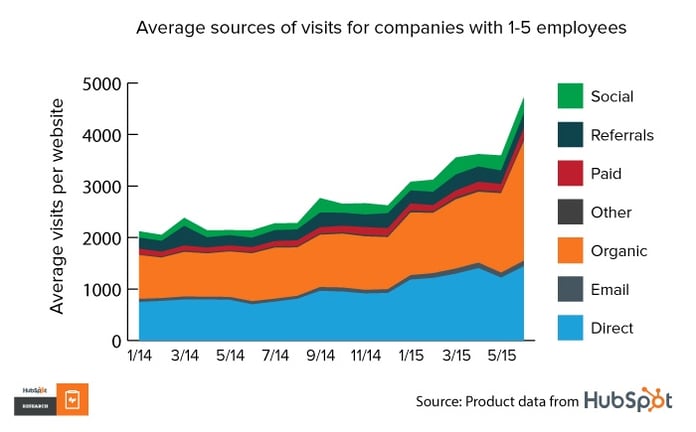
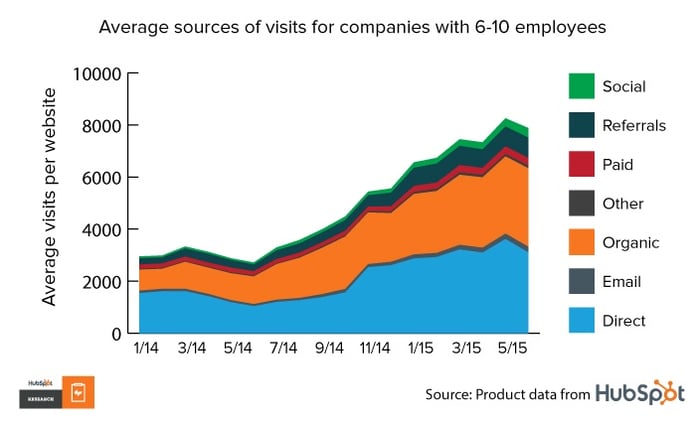
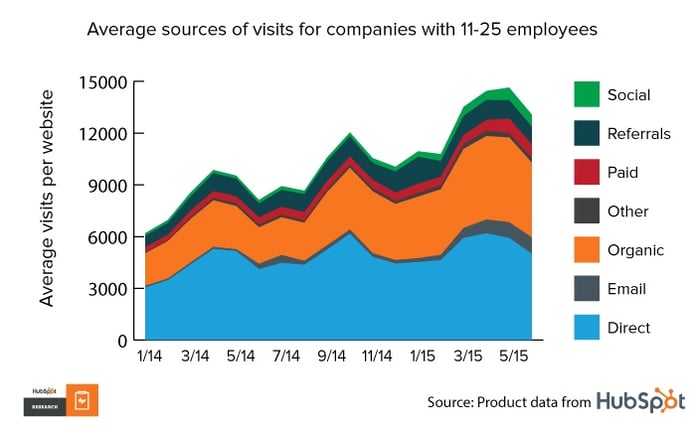
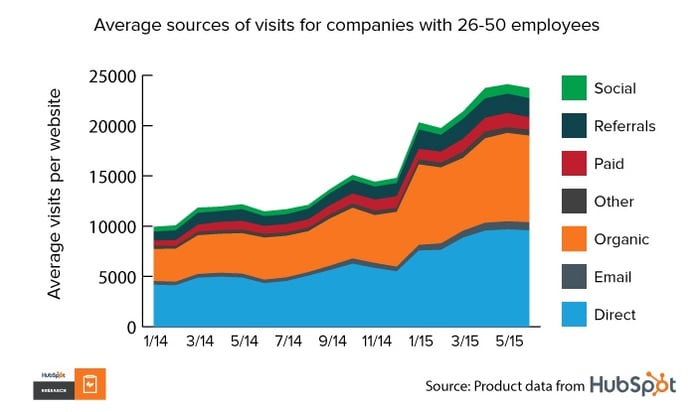
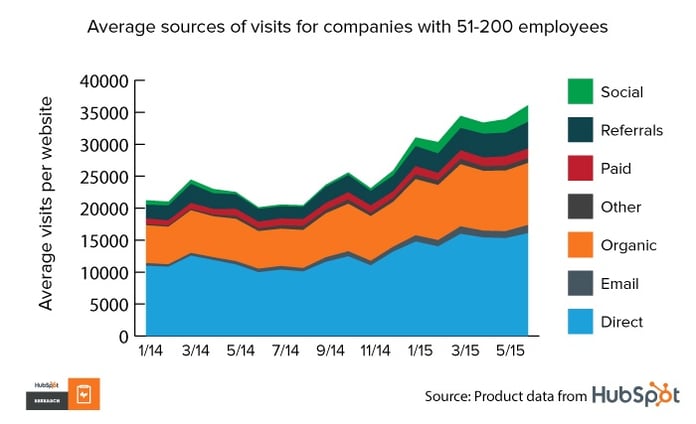
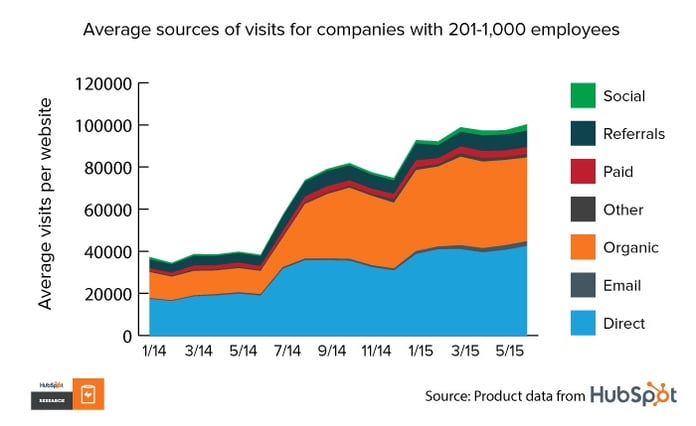
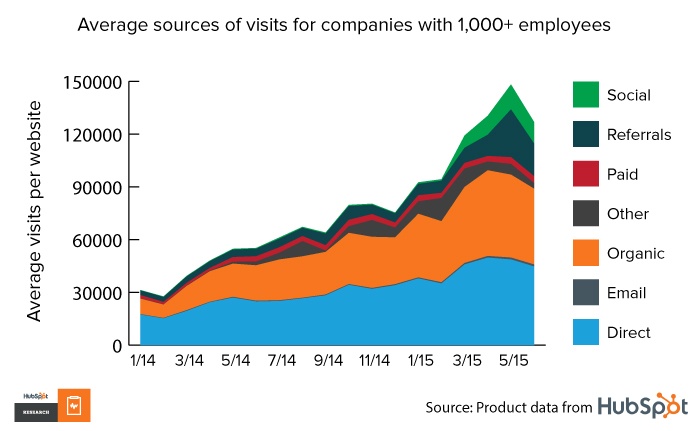
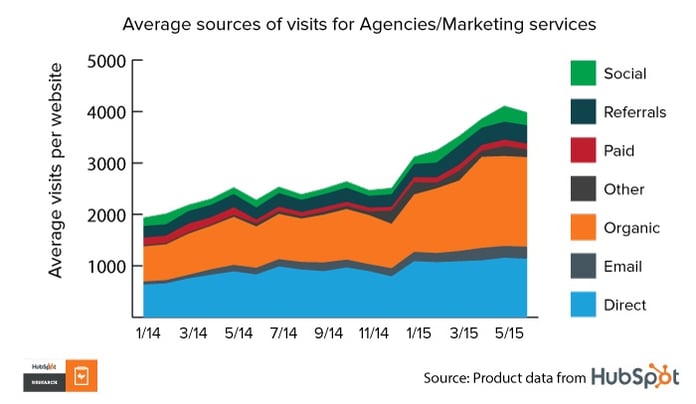
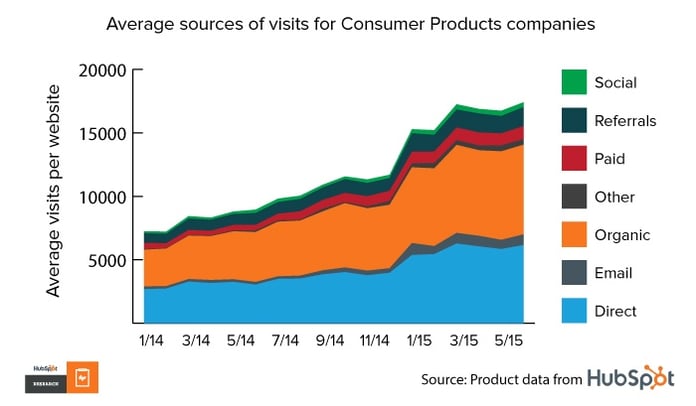
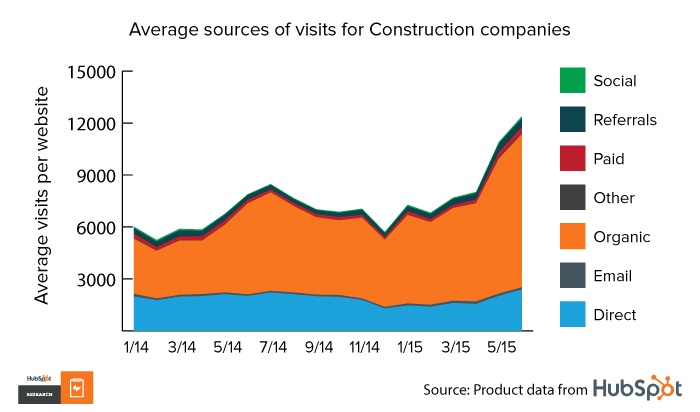
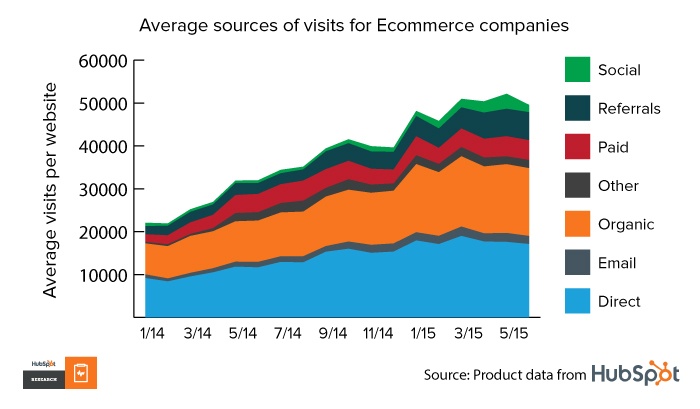
HubSpot Research exported sources data from HubSpot’s Marketing product and created website visit benchmarks across business type, employee size, region, and industry. HubSpot Research calculated the proportion of total visits each channel generates across January 2014 through May 2015. The detailed charts below also represent the average number of visits received each month from each traffic source.
(Click each chart to access the downloadable version)
Table of Contents
B2B and B2C
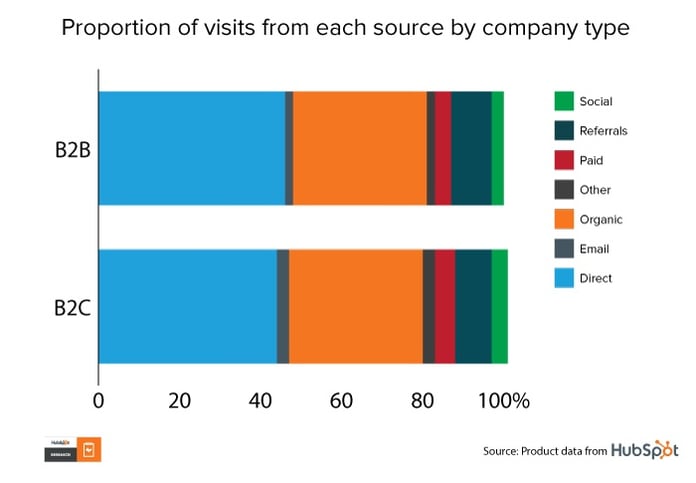
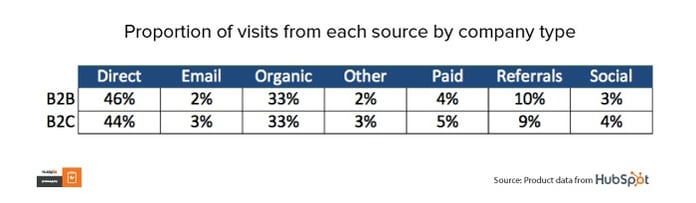
Detailed charts
Company Size
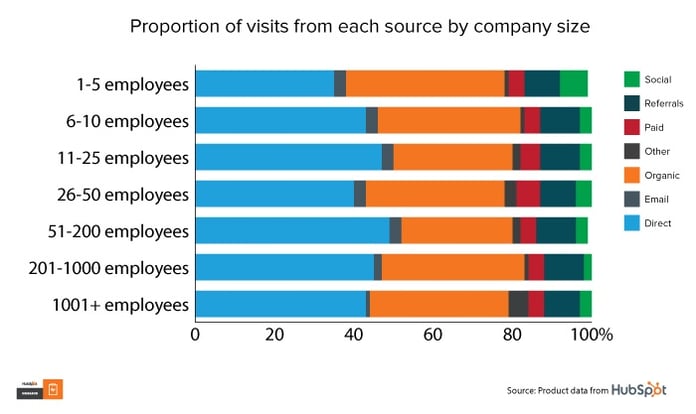
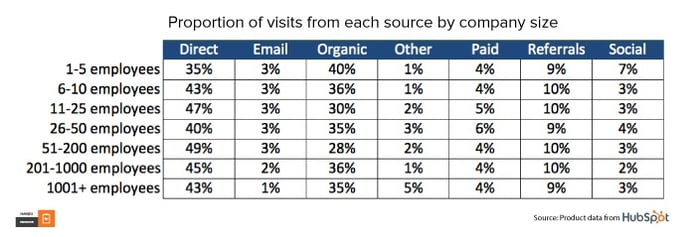
Detailed charts
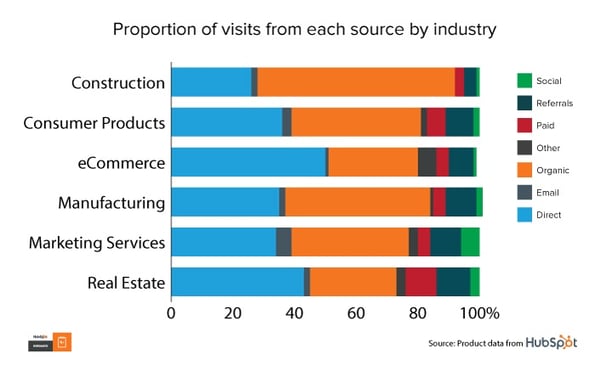
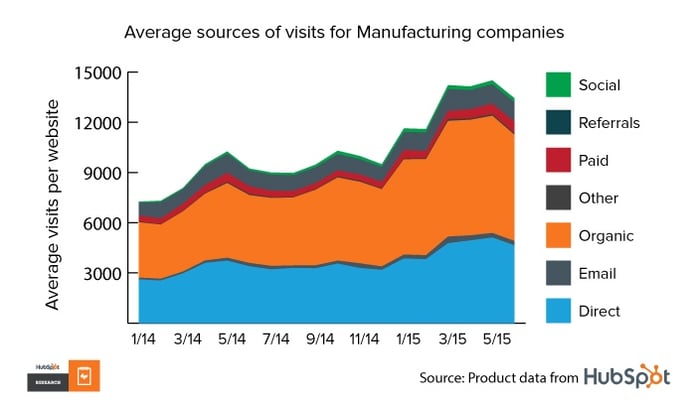
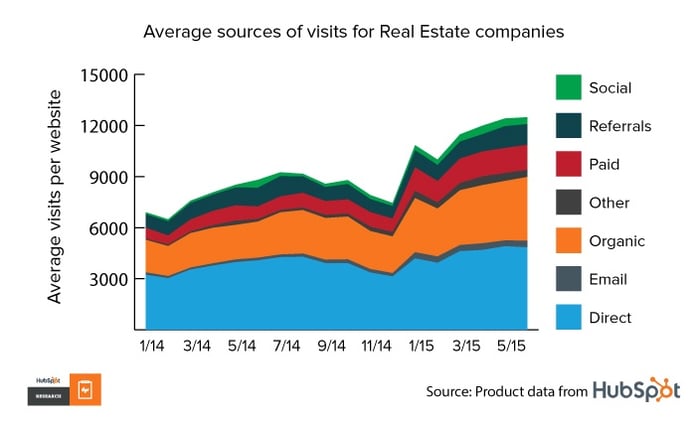
Industry

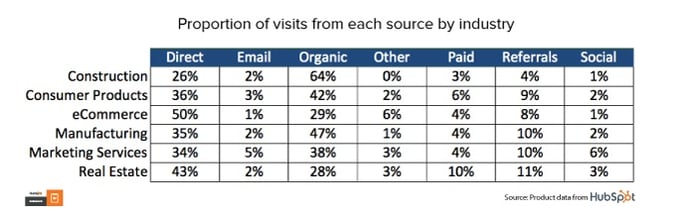
Detailed charts
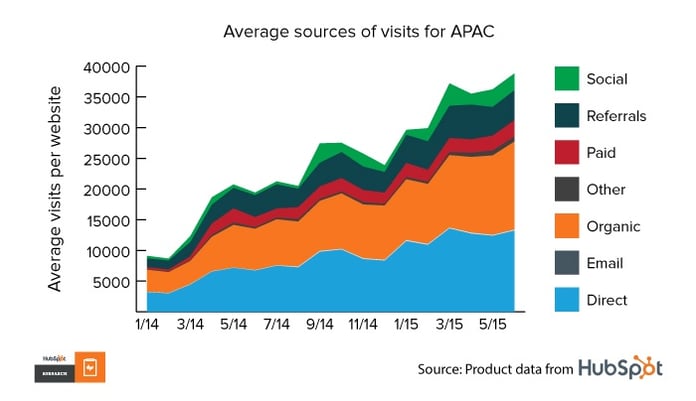
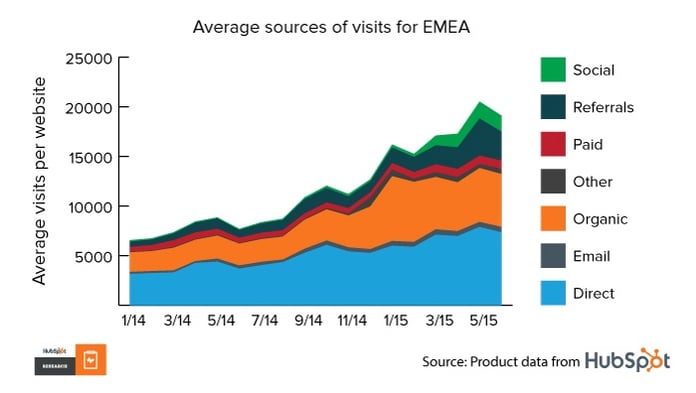
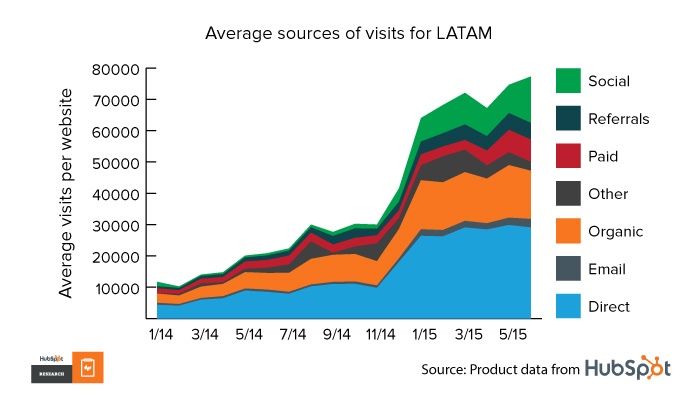
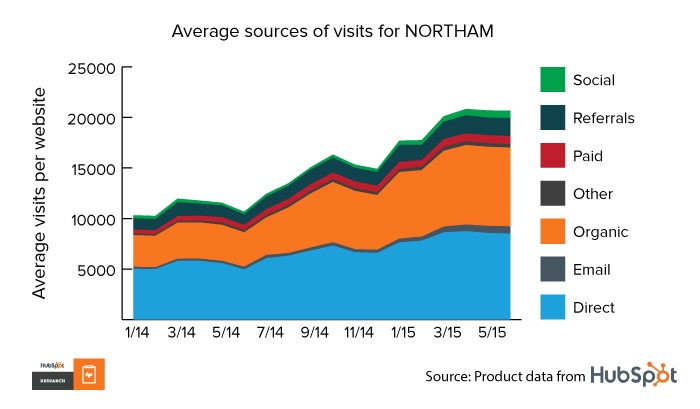
Region
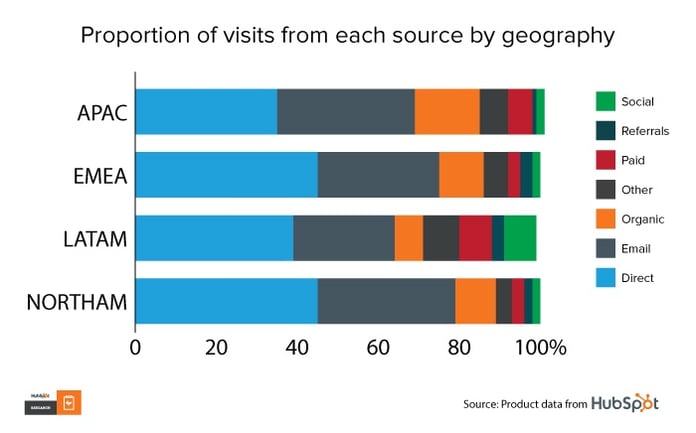
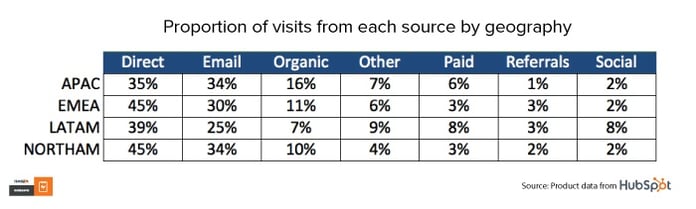
Detailed charts
This report contains links for HubSpot Content, Products, and Services.

![How AI Perceptions Have Changed in the Last Decade [Comparing New & Old Consumer Data]](https://blog.hubspot.com/hubfs/artificial-intelligence-is-here_3.webp)